Streamline Your Security Operations
Hunters Next-Gen SIEM leverages AI and automation to prioritize, investigate, and respond to alerts.
.png)

Built for Small Security Teams
Hunters Next-Gen SIEM makes small teams more effective and efficient.
.png)
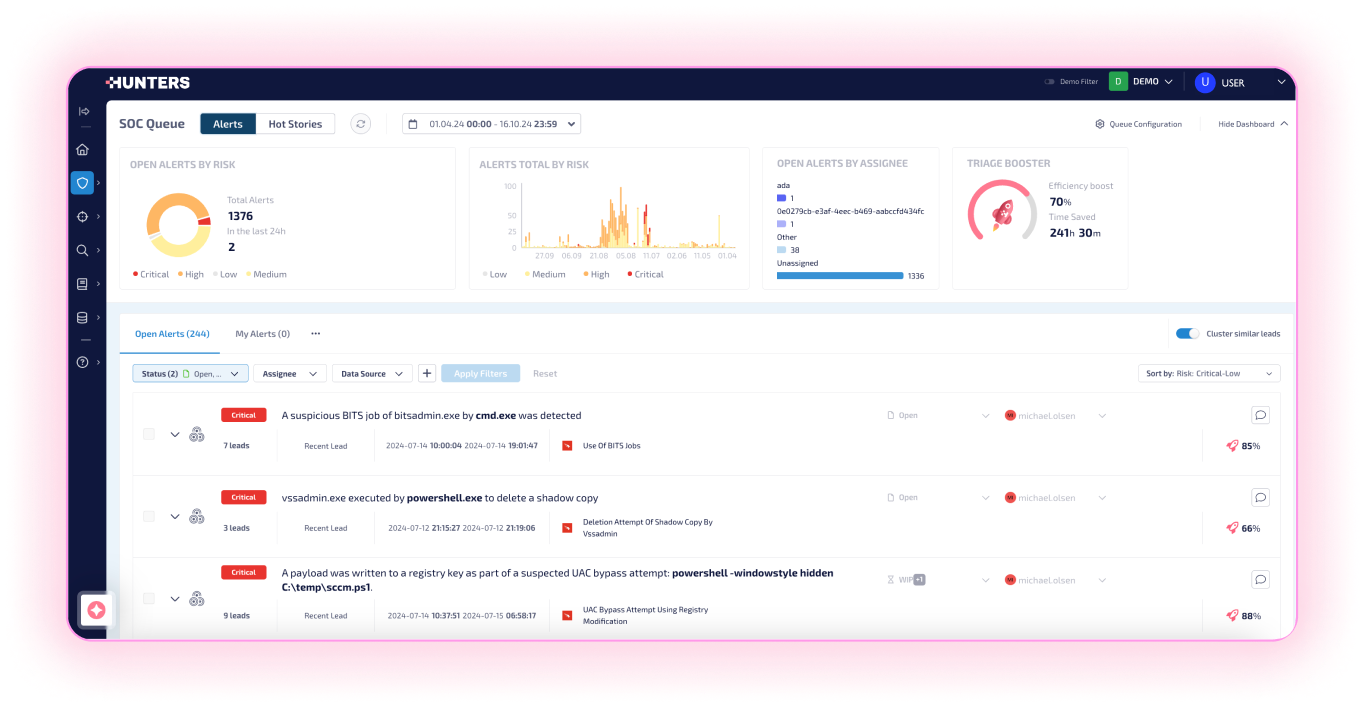
Speed Investigations With AI
And Automation
Hunters reduces alert triage by 80% by automatically investigating every alert with the expertise of a seasoned analyst—no playbooks required. False positives are resolved and critical threats surfaced, with full attack context and related alerts grouped. GenAI provides threat summaries, explanations, and final investigation steps. Analysts can respond with one click.
.png)
Eliminate Detection Engineering
Effortlessly ingest data across your stack for maximum visibility. Skip the burden of detection engineering and reduce excessive alerting by 90%. Hunters correlates data sources to identify attacks that could be missed in isolation and provides built-in detections that are continuously tested and refined by Team Axon.
.png)
Build A Security Data Lake At
A Predictable Cost
Scale data volumes cost-effectively. Simplify access to your data and free your organization from vendor lock-in with a security data lake. Bring your own or let Hunters manage it for you. With all data standardized to OCSF, you’ll benefit from enhanced interoperability across tools and more effective threat detection and response.
.png)
Deploy In Days And Ditch The Upkeep
Hunters' out-of-the-box solution enables SIEM deployment in days, without professional services. By automating threat detection, investigation, and response, Hunters eliminates the hassle of ongoing SIEM management.
Built for Small Security Teams
Hunters Next-Gen SIEM makes small teams more effective and efficient.
Speed Investigations With AI
And Automation
Hunters reduces alert triage by 80% by automatically investigating every alert with the expertise of a seasoned analyst—no playbooks required. False positives are resolved and critical threats surfaced, with full attack context and related alerts grouped. GenAI provides threat summaries, explanations, and final investigation steps. Analysts can respond with one click.
Eliminate Detection Engineering
Effortlessly ingest data across your stack for maximum visibility. Skip the burden of detection engineering and reduce excessive alerting by 90%. Hunters correlates data sources to identify attacks that could be missed in isolation and provides built-in detections that are continuously tested and refined by Team Axon.
Build A Security Data Lake At
A Predictable Cost
Scale data volumes cost-effectively. Simplify access to your data and free your organization from vendor lock-in with a security data lake. Bring your own or let Hunters manage it for you. With all data standardized to OCSF, you’ll benefit from enhanced interoperability across tools and more effective threat detection and response.
Deploy In Days And Ditch The Upkeep
Hunters' out-of-the-box solution enables SIEM deployment in days, without professional services. By automating threat detection, investigation, and response, Hunters eliminates the hassle of ongoing SIEM management.
AUGMENT YOUR TEAM WITH OUR CYBERSECURITY EXPERTS
Need extra assistance? Rely on Team Axon to be an extension of your team. From rapid response to emerging threats and incident investigations to proactive threat hunting and security posture reporting, they provide the expertise and support you need to stay ahead of cyber risks.

Trusted by Teams Like Yours

Score 4.8/5.0
How Hunters is Shaping the Future of Reliable Security Detection
Director, IT Security and Risk Management
Provides an instant boost to security monitoring and can scale more than a traditional SIEM
AVP Information Security
Amazing product with lots of capability and operational efficiency
Security Analyst
Ready to see
Hunters in Action?

Recommended resources
Webinar: Supercharge Your Security Team with Agentic & Copilot AI

GitHub Actions Supply Chain Attack(s): tj-actions & reviewdog